From Bench to Bedside: Clinical practice examples
Example 2: The Netherlands Cancer Institute - Antoni van Leeuwenhoek hospital in Amsterdam, the Netherlands - outpatient
Background
The Netherlands Cancer Institute - Antoni van Leeuwenhoek (NKI-AVL) is a comprehensive cancer centre specialized in the diagnosis and treatment of many types of cancer. Since 2021, PROMs have been implemented in the NKI-AVL for use in the outpatient clinics for already 10 types of cancer. Patients complete PROMs on set times before, during, and after treatment, which are discussed with them by their healthcare provider. However, as the NKI-AVL is also an international renowned scientific institute, PROMs data is also used to research patterns of health-related quality of life (HRQOL) and symptoms in patient populations. On an aggregated level, the data will inform decisions about patient-care and quality of care.


Aligning care with patient’s needs: We use PROMs primarily to guide care for individual patients completing them routinely as part of clinical care. The goal is that HCPs review and discuss results during outpatient consultations to align treatment and supportive care with patient needs. The dataset also supports research and quality improvement.
Included cancer types: We include patients with all cancer types. PROMs are currently implemented for: non-metastatic breast cancer; melanoma (stage II/IV); bladder cancer (surgery or chemo-radiation); head and neck cancer; upper GI cancers (stomach, oesophagus); colorectal cancer; neuroendocrine cancers; thyroid cancer; and gynaecological cancers. In the future, we aim to extent the assessment to prostate cancer, testis cancer, kidney cancer, non-melanoma skin cancer, lung cancer, brain tumours, and sarcoma.

Instruments: All patients complete the EORTC QLQ-C30 and the EQ-5D. Furthermore, PROMs are tailored by adding cancer-specific questionnaires (e.g., EORTC modules such as the QLQ-BR23 for breast cancer, including hormonal-therapy side effects) and symptom-specific questions (e.g., urinary complaints for bladder cancer). At baseline, additional questions cover comorbidities, lifestyle, and demographics, which are relevant for HRQoL and support interpretation of PRO data.
Questionnaires are selected in consultation with healthcare providers, informed by the literature on internationally standardised outcome sets as well as by recommendations from national professional associations and the clinical audit.
Frequency: Measurement schedules are aligned with each cancer type’s course of care, while aiming for standardisation across cancer types to enable research use. Typical schedules include:
- Baseline → 3/6/12 months after surgery → annual follow-up up to 5 years
- Baseline → 3/6/9/12 months after diagnosis - → annual follow-up up to 5 years
Because tailoring PROMs across many cancer types is complex, a “blueprint” summarises the key decisions required before technical implementation and is used to structure discussions with HCPs.

Electronical assessment as a facilitator: PROs are collected electronically within the routine electronic health record EHR (HiX 6.3, ChipSoft). HiX includes a patient portal where surveys can be completed and results viewed. PROMs have been programmed in the portal to be automatically stored in the EHR.
EHR integration was chosen because it is a key facilitator in the PROM implementation literature and because HCPs preferred not to work with an external application. Despite being favoured, available vendors could not provide a workable EHR link.
Access via the patient portal: PROMs are provided through the online patient portal. Patients are invited once by their HCP via the EHR, and follow-up assessments are then triggered automatically. The portal is accessed via the hospital website. Patients log in using their digital identifier (DigiD, also used for government services) and complete the PROMs online.

Pilot phase: PROM implementation started with two cancer types (melanoma and breast cancer) supported by two enthusiastic HCPs and volunteering patients. The pilot revealed key technical opportunities and barriers and led to a “blueprint” that later guided roll-out to other cancer types. Meanwhile, melanoma and breast cancer patients were already being invited to complete PROMs.
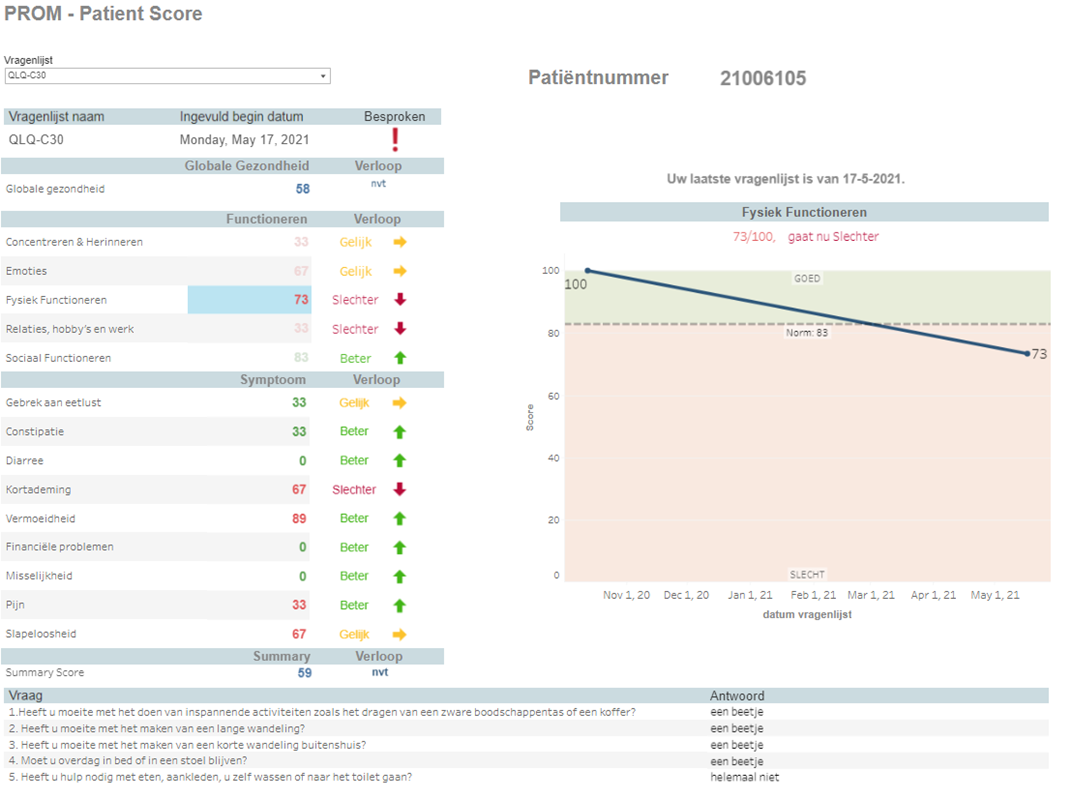
Presentation of results: After ~25 patients had completed PROMs, a dashboard was developed to present the PRO data to HCPs. A comparable patient dashboard could not be displayed in the portal, so patients currently see only numeric scores and responses of the questions. Because patients want access to their results, HCPs should explain the scores during consultations.
Small project group: The project started with a small core team (project lead, the two HCPs, IT manager, chief medical information officer, quality officer, and a senior PROM/HRQoL researcher) meeting monthly to develop the EHR-based ePRO structure and plan next steps.
Selection of PROMs within specialized teams for each cancer type: At NKI, multidisciplinary cancer-type teams selected PROMs. For each new cancer type, the project was presented at the team meeting. A representative was appointed, PROM content and frequency were agreed in a proposal, and the representative obtained formal team approval for the proposal.
Training of HCPs on the assessment, interpretation and communication of PROMs: Once PROMs were built into the EHR, HCPs were trained to invite patients. After initial use, additional training covered accessing the dashboard, interpreting scores, and discussing results with patients. Despite a comprehensive training concept, HCPs preferred shorter sessions.
Ongoing implementation: Technical PROM resources are available for 10 cancer types, but implementation and formal evaluation are still ongoing to identify and implement potential for improvement. Progress and next steps are reviewed quarterly in the project group.

PROM Dashboard: The dashboard provides an overview of PRO data. We use thresholds of clinical importance (Giesinger et al.) to color code the graphical display of PRO data:
- Red = worse than the threshold (clinically important problem)
- Green = better than the threshold
Change over time (provisional rule): Because clear guidelines for interpreting longitudinal change were lacking, we initially used a 10-point difference.
Thresholds and scores over time are also shown in a graph that opens when you click a domain.

Responsibility to one HCP per measurement time point: We found that when everyone is responsible, no one feels accountable. Therefore, we now assign each measurement time point to one specific HCP.
Example: During annual clinical follow-up, the oncologist who sees the patient is assigned responsibility for discussing the PROMs for all follow-up measurements.
We are monitoring whether this approach increases the proportion of PROMs that are discussed with patients.

Referral to supportive care: HCPs who review PROMs with patients can refer directly to clinical or non-clinical supportive care services.If the appropriate referral is unclear, they can refer first to a specialised supportive-care nurse for triage. At the NKI-AVL, there are three specialised supportive-care nurses or more consultations, assess supportive-care needs and propose a comprehensive care plan.
Self-management support: We are currently implementing a self-management portal within the PROMs dashboard offering tools and recommendations for self-support, including:
- digital patient information
- self-help apps
- eHealth tools
- online decision-support
Patients can access these resources themselves after discussing their PROM scores with their HCP.
Patients can view their PRO data and receive feedback in the online portal. However, due to technical limitations, there is currently no dashboard; patients see numeric scores only (table format).
We are currently exploring ways to improve how results are displayed and consider it essential that patients can:
- see their scores,
- understand/interpret them
- use them to inform their health and healthcare.

Implementation is an ongoing process: While it helps to plan thoroughly, you eventually need to start making real changes. We therefore began with a basic implementation and are refining and improving it step by step.
1Albers EAC, Fraterman I, Walraven I, Wilthagen E, Schagen SB, van der Ploeg IM, Wouters MWJM, van de Poll-Franse LV, de Ligt KM. Visualization formats of patient-reported outcome measures in clinical practice: a systematic review about preferences and interpretation accuracy. J Patient Rep Outcomes. 2022 Mar 3;6(1):18. doi: 10.1186/s41687-022-00424-3. PMID: 35239055; PMCID: PMC8894516.